The 150 Mpc standard ruler — how a sound wave in the primordial plasma became a way to measure distance
The imprint of sound waves in the primordial plasma survives as a preferred
separation between galaxies — a standard ruler roughly 150 Mpc long. Measuring it
at a range of redshifts maps the expansion history.
DESI measures it two ways: from the clustering of discrete tracers out to
z ≈ 2.1, and from Lyman-α forest absorption at z ≈ 2.3. The
cosmological constraints drawn from these measurements are collected under
Cosmological Parameter Estimation. Forest catalogs,
systematics and the pipeline reference set are on the
Lyman-α page.
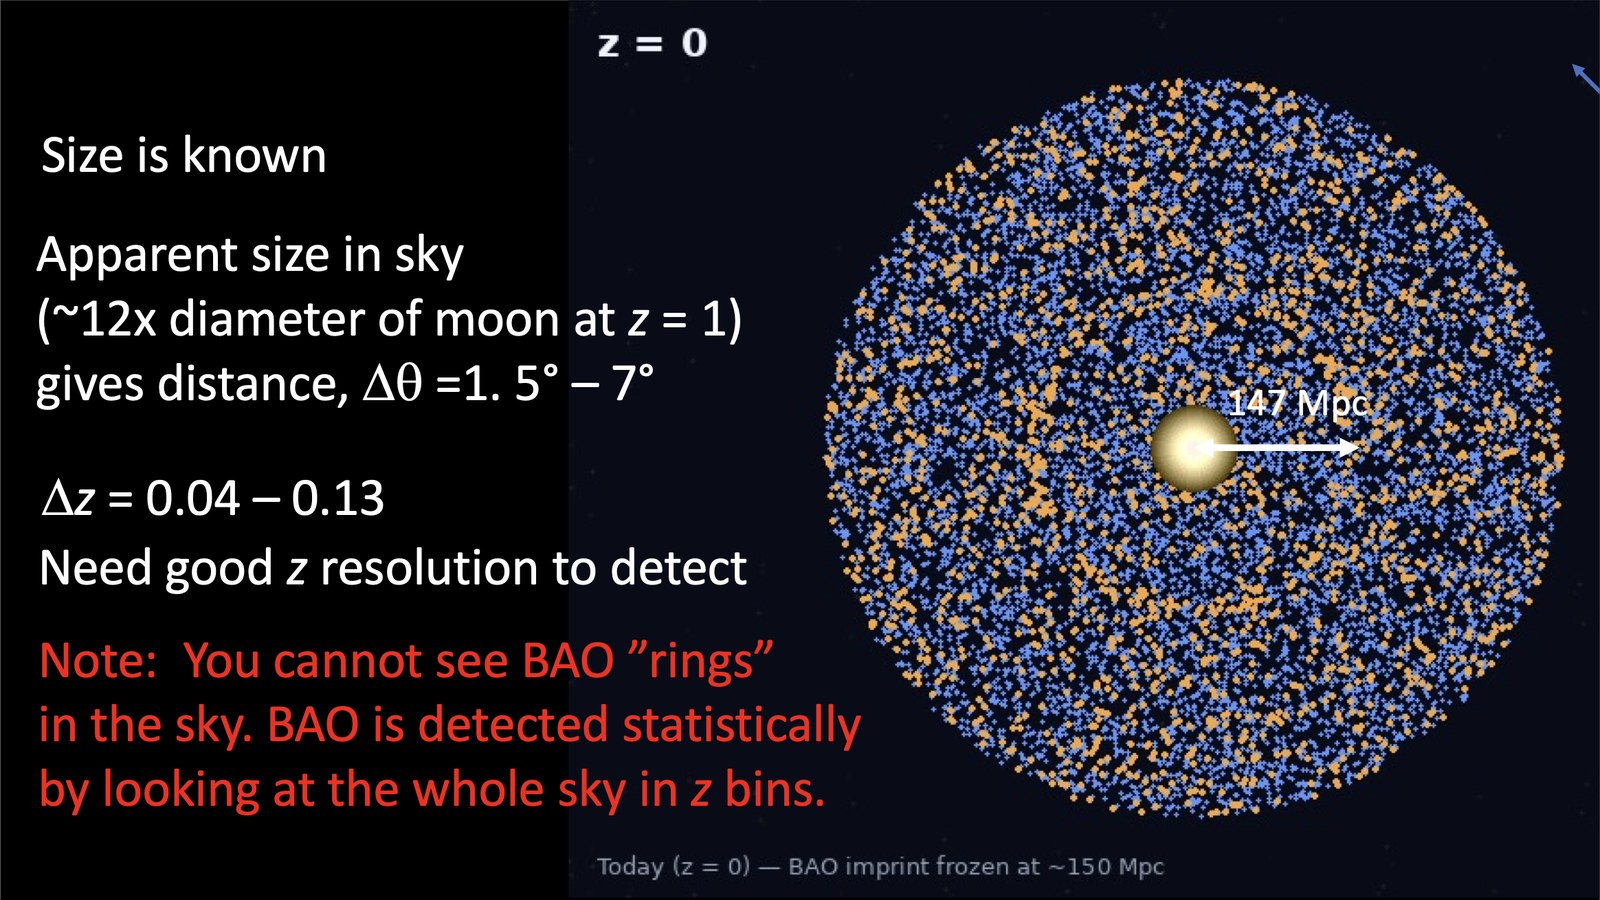
In the above figure, blue is cold dark matter and orange is
baryons.
Dark matter takes no part in the acoustic oscillation: it is pressureless, so the
sound wave cannot push it, and it simply stays where it began. Only the baryons are
carried outward and left standing in a shell when the wave freezes. The 147 Mpc
arrow measures a baryon feature — which is why these are called baryon
acoustic oscillations, and why the dark matter shows here as a smooth central
concentration rather than a ring.
Why a known length is useful. Because the ruler's true size is fixed by
ΛCDM, its apparent size on the sky gives the distance directly —
about twelve times the diameter of the moon at z = 1, or
Δθ = 1.5°–7° across the survey's redshift range. Along
the line of sight the same scale appears as
Δz = 0.04–0.13, which sets how good the redshift
resolution has to be — and is why DESI is a spectrograph rather than an imager.
The warning in red matters more than it looks. Nothing in the sky is arranged in
visible rings. The shell around any one overdensity is a faint statistical excess,
swamped by everything else along the line of sight; BAO appears only after
correlating millions of galaxies in redshift bins.
By J. W. Rohlf, from
Results From DESI,
Division of Particles and Fields, Fermilab, July 2026. The simulation is the same
one shown running on the ΛCDM page. To get
θBAO at a redshift of your choosing, use the
Cosmology Calculator with BAO Scale.
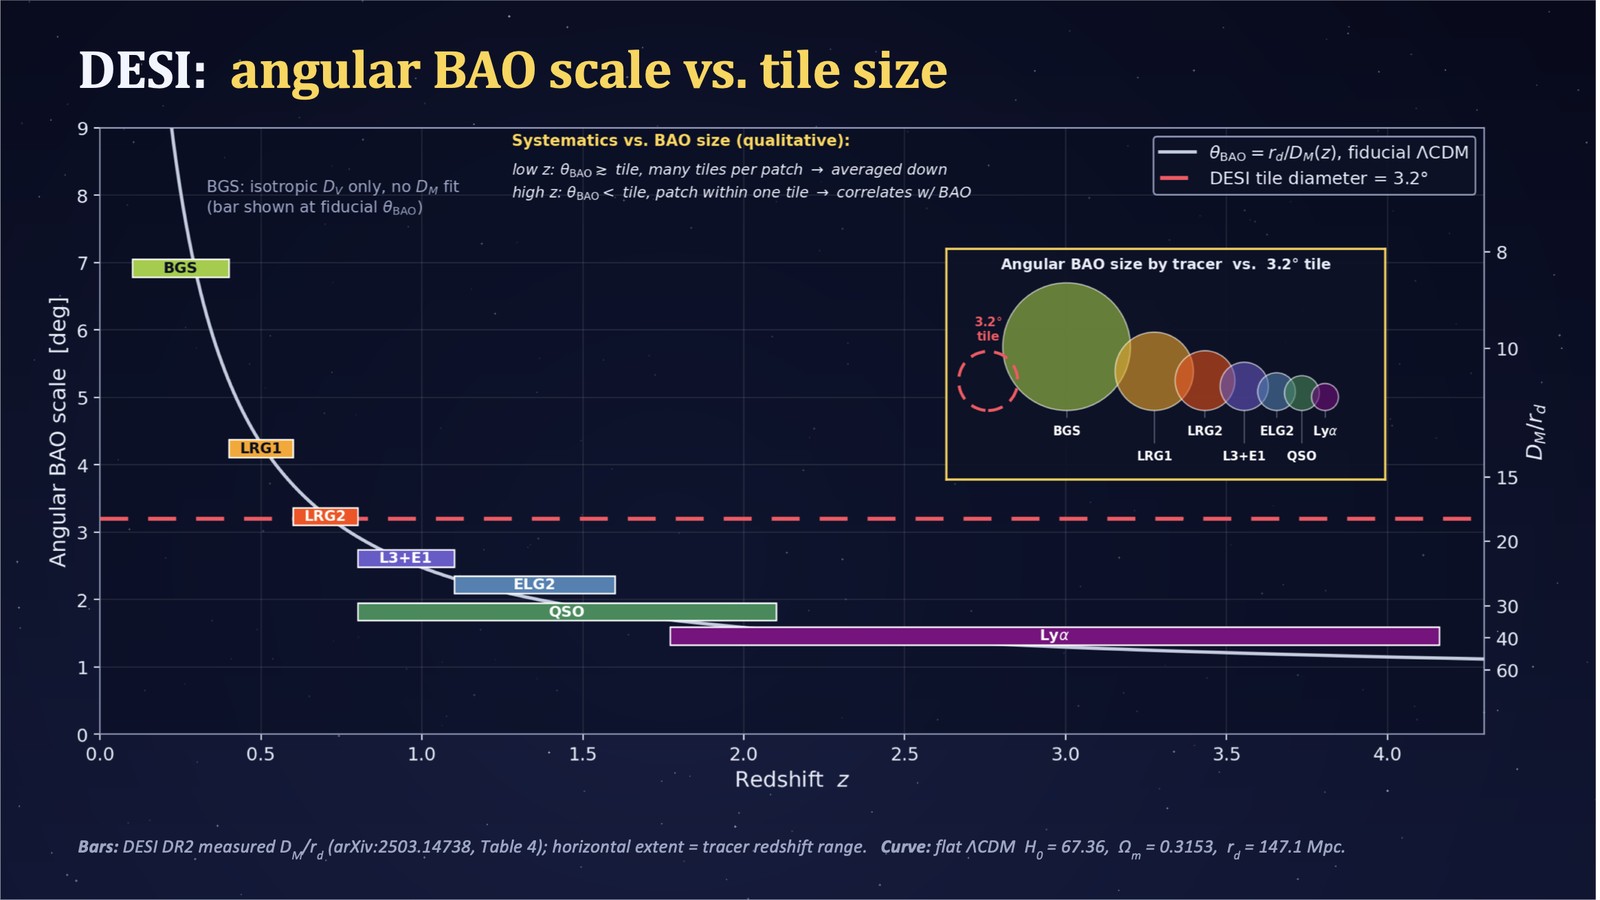
The same angular scale, now measured, and set against the size of a single DESI
pointing. The white curve is
θBAO = rd/DM(z)
for the fiducial cosmology; the bars are the DR2 measurements, each placed at its
measured value and spanning its tracer's redshift range.
The red dashed line is the thing to look at. A DESI tile is 3.2° across, and the
BAO scale crosses it at around z ≈ 0.7 — right at LRG2.
Below that redshift the feature is larger than the field of view, so any
patch of sky containing it is built from many separate pointings and the
observational systematics of any one tile average down. Above it the feature is
smaller than a tile, so a whole BAO-sized patch can sit inside a single pointing —
and then whatever that tile does badly is correlated with the signal itself. The
inset makes the comparison directly: BGS dwarfs the tile, Lyman-α fits inside
it several times over.
By J. W. Rohlf, from
Results From DESI,
Division of Particles and Fields, Fermilab, July 2026. Bars from DESI DR2,
arXiv:2503.14738, Table 4; curve for flat ΛCDM with
H0 = 67.36,
Ωm = 0.3153,
rd = 147.1 Mpc.
Galaxies & Quasars
Key paper · DR2
DESI DR2 Results II: Measurements of Baryon Acoustic Oscillations and
Cosmological Constraints
M. Abdul Karim et al. (DESI Collaboration) · Physical Review D 112, 083515 (2025)
· arXiv:2503.14738
BAO from three years of DESI data across the full set of tracers — bright
galaxies, luminous red galaxies, emission-line galaxies and quasars.
Key paper · DR1
DESI 2024 III: Baryon Acoustic Oscillations from Galaxies and Quasars
DESI Collaboration · Journal of Cosmology and Astroparticle Physics 04, 012 (2025)
· arXiv:2404.03000
The first-year measurement, whose combination with CMB and supernova data first
showed a preference for time-evolving dark energy.
Supporting papers
Clustering catalogs and systematics: sample definitions and two-point statistics,
BAO reconstruction, fiber-assignment realizations, and halo-occupation systematics
for emission-line galaxies.
Loading references…
Lyman-α Forest
The forest reaches z ≈ 2.3, the only DESI probe deep in the
matter-dominated era. Both analyses use the forest auto-correlation together with
its cross-correlation with quasar positions.
DR2
Loading references…
DR1
Loading references…
Ahead
DESI completed its five-year survey in May 2026. BAO from the full survey is
expected in early 2027 and will be added here.